
Bitcoin and Ethereum ETFs Attract Nearly $900 Million as BTC Breaks Above $81,000
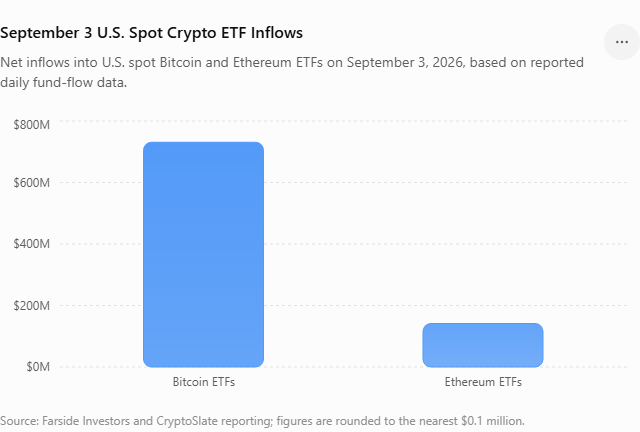
Bitcoin and Ethereum have started September with renewed momentum as U.S. spot exchange-traded funds recorded a combined $872.2 million in net inflows on September 3, according to the latest reporting. Bitcoin ETFs accounted for the overwhelming majority of the capital, attracting $730.8 million, while Ethereum ETFs collected approximately $141.4 million. At the same time, Bitcoin climbed above $81,000, while Ethereum moved beyond $2,500, giving the cryptocurrency market a much-needed burst of confidence after a volatile stretch.
The significance of the move goes beyond the headline numbers. ETF inflows represent actual investment demand for exchange-traded products, while the price rally itself was also helped by traders closing bearish positions. According to reporting from CryptoSlate, Bitcoin futures open interest climbed above $57 billion, while more than $260 million in short positions were liquidated during the advance. That combination creates an interesting market structure: fresh spot demand is arriving at the same time that leveraged traders are being forced to buy back positions.
For investors watching the crypto market, the key question is whether this represents the beginning of a sustained accumulation phase or simply another sharp rally inside a volatile market. Bitcoin has already demonstrated that it can recover rapidly when sentiment changes, but elevated leverage can also make rallies fragile. Ethereum faces a similar test, particularly after its ETF flows reversed from an outflow on September 2 to a substantial inflow the following day.
Bitcoin Breaks Above $81,000
Bitcoin’s move above $81,000 has become the most visible sign that buyers are regaining control of the short-term market. The cryptocurrency had previously struggled around the $77,000–$80,000 region, so pushing beyond $81,000 represents a meaningful change in momentum. On September 4, Bitcoin briefly climbed as high as approximately $82,164, its strongest intraday level since May, before pulling back modestly.
The rally was particularly notable because Bitcoin started the week close to the $77,000 area. A move of several thousand dollars in only a few sessions shows just how quickly sentiment can change in cryptocurrency markets. Once BTC began moving higher, short sellers were forced to close positions, adding another layer of buying pressure to the underlying spot demand. This creates a snowball effect in which a modest initial move can become much larger as leveraged traders scramble to adjust their positions.
Current market data therefore present a more constructive picture than they did earlier in the week, but the rally still needs confirmation. A brief move above $81,000 is one thing; establishing support above $80,000 and eventually clearing the $82,000–$83,000 region would be much stronger evidence that buyers have taken control. Traders should therefore focus less on one hourly price spike and more on whether Bitcoin can maintain higher lows after the breakout.
Why $80,000 Became a Critical Bitcoin Level
The $80,000 level has become a psychological dividing line for Bitcoin. Round numbers naturally attract attention, but this particular level has also acted as an important area of resistance during the recent trading range. When BTC was unable to hold above it, sellers repeatedly pushed the price lower, creating uncertainty about whether the market could recover.
Now the situation is changing. Bitcoin has moved back above $80,000, which means traders are watching to see whether the former resistance becomes support. This is a common feature of technical markets: once buyers finally overcome a major barrier, they often need to defend that same area during the next pullback.
The latest rally gives bulls an opportunity to prove that the market has genuinely shifted. If BTC falls toward $80,000 but buyers quickly step in, that would provide stronger confirmation than another temporary spike toward $82,000. If Bitcoin instead loses $80,000 immediately and starts moving back toward $77,000, the recent breakout could begin looking more like a failed move.
Ethereum Moves Above $2,500
Ethereum has also joined the recovery, with ETH moving above $2,500 as institutional demand returned to its spot ETF products. The move is important because Ethereum had experienced a brief interruption in its ETF inflow streak immediately before the latest surge. CryptoSlate reported that Ethereum ETFs saw approximately $48.2 million of net outflows on September 2, ending a 12-session inflow streak, before reversing with $141.4 million of inflows on September 3.
That reversal shows how quickly institutional positioning can change. One day of outflows does not necessarily mean investors have abandoned Ethereum, just as one day of inflows does not prove that a permanent accumulation cycle has begun. What matters is whether the market can sustain positive flows while ETH holds above important technical levels.
Ethereum’s performance is also relevant because it demonstrates that the latest crypto rally is not limited entirely to Bitcoin. When capital begins flowing into both BTC and ETH ETFs at the same time, it can indicate broader institutional interest in digital assets rather than a single-asset trade. That broader participation can make a market move more durable, although it does not remove the risk of sudden reversals.
ETH ETF Demand Rebounds
Ethereum’s ETF recovery was particularly concentrated. BlackRock’s ETHA and Fidelity’s FETH attracted a combined $137.2 million, accounting for almost the entire category’s net inflow on September 3, according to CryptoSlate. That concentration shows how strongly investor demand can be focused on the largest and most established products.
For Ethereum bulls, continued ETF demand would provide an important source of support. Spot ETF purchases can create demand that is separate from short-term speculative trading, giving the market a deeper pool of potential buyers. If ETH can continue attracting capital while remaining above $2,500, traders may begin treating that level as an important new support zone.
The immediate technical challenge is therefore not simply reaching $2,500. Ethereum needs to demonstrate that buyers are willing to defend the area after the initial excitement fades. If that happens, higher resistance levels could come into focus. If the price quickly drops back below $2,500, however, the latest move could prove to be another momentum-driven rally rather than a lasting trend reversal.
Nearly $900 Million Flows Into Crypto ETFs
The combined $872.2 million inflow into U.S. spot Bitcoin and Ethereum ETFs on September 3 is the central statistic behind the latest market rally. Bitcoin contributed $730.8 million, while Ethereum added $141.4 million, creating one of the strongest single-day institutional demand signals seen during the recent recovery.
What makes the number especially interesting is its timing. Bitcoin and Ethereum had both experienced uneven trading and changing ETF flows during the preceding sessions. Bitcoin ETFs moved from a $236.5 million outflow on September 1 to a $101.1 million inflow on September 2 before the massive $730.8 million inflow on September 3. Farside’s daily data confirms those figures and shows that BlackRock’s IBIT alone recorded approximately $454 million of inflows on September 3.
This pattern suggests that institutional sentiment can change rapidly when macroeconomic expectations and cryptocurrency momentum align. The key question now is whether the September 3 inflow represents a one-day burst or the beginning of a sequence of strong inflows. If capital continues entering the products, the latest rally could receive a stronger foundation; if flows reverse sharply, traders may question whether the move was mostly driven by short covering.
BlackRock Leads Bitcoin ETF Demand
BlackRock’s IBIT was the clear leader among Bitcoin ETFs on September 3, attracting approximately $454 million. That represented roughly 62% of the day’s total Bitcoin ETF inflow, making IBIT the dominant destination for the fresh capital. ARK 21Shares’ ARKB followed with approximately $137.7 million, while Fidelity’s FBTC collected about $74.4 million.
The concentration is significant because large ETF products have become major channels through which traditional investors can gain Bitcoin exposure. Strong flows into the biggest funds can therefore influence market sentiment beyond the ETF market itself. Traders watching the underlying asset often interpret persistent institutional buying as a sign that larger investors are willing to absorb available supply.
Still, one should avoid treating IBIT’s strong inflow as a guaranteed signal that Bitcoin must rise. ETF flows can change quickly, and investors can move capital in response to prices, economic data and risk conditions. The better signal is a sustained pattern in which strong inflows continue while Bitcoin builds a higher price structure.
Fidelity and ARK 21Shares Also Attract Capital
The participation of ARKB and FBTC provides another useful piece of the puzzle. While BlackRock dominated the day’s flow, other major funds also recorded meaningful inflows, suggesting the demand was not isolated to a single ETF issuer. That broader participation can be more encouraging than a situation where one product receives almost all of the day’s capital.
The combined flow also shows why ETF data are increasingly relevant to Bitcoin analysis. Instead of looking only at exchange trading volume or futures positioning, market participants can now watch regulated investment products to understand whether traditional capital is moving toward or away from the asset.
The trend becomes especially useful when ETF flows and price action agree. Rising prices alongside strong inflows generally provide a more constructive signal than rising prices alongside heavy outflows. Conversely, if Bitcoin rallies while ETFs experience persistent redemptions, traders may wonder whether the move is being driven primarily by leverage rather than genuine spot demand.
Bitcoin ETF Flows Signal Fresh Institutional Demand
The latest inflows offer evidence that institutional interest has returned after a period of uncertainty. Farside’s data show a dramatic shift from the $236.5 million outflow on September 1 to $101.1 million of inflows on September 2 and then $730.8 million on September 3. That is a substantial three-session swing and illustrates just how quickly capital can return when market sentiment changes.
The important word here is demand. Short covering can push Bitcoin higher, but ETF purchases represent a different market force because the funds provide exposure through spot-backed investment vehicles. When large inflows coincide with a price breakout, they can help absorb selling pressure that might otherwise stop the rally.
Simon-Peter Massabni of XS.com told CryptoSlate that flows of this size absorbed substantial sell orders and helped lift spot prices despite higher sovereign bond yields in the United States and Japan. His comments underline the significance of the flow data, although market participants should still consider ETF flows alongside broader macroeconomic conditions rather than treating them as a standalone predictor.
Ethereum ETF Flows Show a Similar Pattern
Ethereum’s ETF market tells a similar story but on a smaller scale. The $141.4 million inflow on September 3 was a significant reversal from the $48.2 million outflow recorded the previous day. That quick turnaround suggests that the September 2 withdrawal did not necessarily represent a fundamental change in institutional sentiment toward ETH.
Ethereum’s performance also benefits when Bitcoin establishes a stronger market backdrop. Bitcoin generally remains the dominant cryptocurrency by market capitalization, so a strong BTC rally can improve overall risk sentiment across the digital-asset market. Once confidence improves, investors may begin looking toward Ethereum and other large assets for additional opportunities.
The ETF data therefore deserve close attention over the next several sessions. If Ethereum continues receiving strong inflows while ETH remains above $2,500, the latest move could develop into a more meaningful recovery. If flows quickly turn negative again, traders may conclude that institutional positioning remains highly tactical rather than part of a long-term accumulation trend.
Short Liquidations Add Fuel to the Rally
ETF demand was not the only force behind Bitcoin’s latest advance. The move higher also triggered a substantial wave of short liquidations, with CryptoSlate reporting that more than $260 million in Bitcoin short positions were liquidated during the advance. When traders betting on falling prices are forced to close their positions, they must buy the asset back, creating additional upward pressure.
This is known as a short squeeze. Imagine a crowded exit where everyone tries to leave through the same door at the same time; the rush itself can make the movement much faster. In Bitcoin markets, a sudden price increase can force leveraged short sellers to close positions, which creates additional buying, which can push the price even higher and trigger more liquidations.
The problem is that short squeezes can work in reverse. Once the forced buying disappears, the market may lose some of its momentum. If leverage remains high, a sudden decline can trigger long liquidations and produce a rapid downward move.
That is why the ETF inflows are particularly important. Genuine spot demand could potentially provide the rally with a more stable foundation than short covering alone.
Why Rising Open Interest Matters
Bitcoin futures open interest reportedly climbed above $57 billion, reaching its highest level since May. Rising open interest means more capital is tied to outstanding futures positions, but it does not automatically indicate whether traders are bullish or bearish. Instead, it tells us that leverage and participation in the derivatives market are increasing.
High open interest can make price movements more explosive. If the market moves in the direction that forces one side to liquidate, those liquidations can accelerate the move. This is exactly what happened during the recent rally as short sellers were forced to close positions.
But high leverage also creates risk for bulls. If Bitcoin fails at $82,000–$83,000 and begins falling, traders holding aggressive long positions could become the next source of forced selling. The market could then experience a rapid reversal even if the longer-term demand picture remains positive.
For that reason, rising open interest should be treated as a volatility signal, not simply a bullish signal.
ETF Flows Versus Short Covering
One of the most important questions surrounding the current rally is how much of the move comes from genuine demand and how much comes from traders being forced to close bearish positions. The answer is probably a mixture of both.
The $872.2 million combined ETF inflow provides evidence of substantial institutional demand, while the more than $260 million in Bitcoin short liquidations demonstrate that leverage amplified the move. These forces can work together: ETF buying pushes the price higher, short sellers react, liquidations accelerate the move, and momentum attracts additional buyers.
The next few trading sessions should reveal which force is stronger. If Bitcoin remains above $80,000 after the initial short squeeze fades, that would suggest the spot market has enough strength to support the rally. If BTC quickly falls back below the breakout level, the market may conclude that leverage contributed more to the move than sustained accumulation.
This distinction is crucial because sustainable rallies generally need buyers after the forced liquidations are finished.
Federal Reserve Expectations Influence Crypto
Macroeconomic expectations remain a major driver of Bitcoin and Ethereum. Recent comments from Federal Reserve Governor Christopher Waller helped improve market sentiment after he indicated that he could support keeping rates steady if inflation continues to show progress. Bitcoin responded by climbing sharply, with the move eventually taking it above $81,000.
However, the macro picture is not completely one-sided. On September 4, U.S. jobs data showed 162,000 new jobs, substantially above the 56,000 expected by markets, while unemployment stood at 4.1%. The stronger labor-market figure supported some expectations of a September rate hike, while softer wage growth and upcoming inflation data kept the policy outlook uncertain.
This creates a difficult environment for crypto traders. Bitcoin can respond positively to expectations of easier monetary policy, but strong economic data can produce the opposite reaction if investors believe rates will remain higher for longer. That is why macro headlines can sometimes overwhelm even strong technical setups.
What Bitcoin Traders Are Watching Next
Bitcoin traders now have several important levels to monitor. The first is $80,000, which needs to behave as support if the breakout is to remain credible. Above that, the market will focus on approximately $82,000–$83,000, an area that has already attracted sellers during previous attempts to recover.
A sustained move above the upper resistance zone could improve the technical outlook and open the possibility of a move toward higher levels. Reuters highlighted approximately $82,793 as an important resistance area, while recent trading has already brought BTC close to that level.
On the downside, $77,000 remains an important reference point. A move below $80,000 would weaken the immediate breakout, while a deeper move below $77,000 would suggest that the market has failed to maintain its latest recovery.
The ETF flow data will be just as important as the chart. Continued strong inflows would strengthen the bullish case, while another large outflow could make the latest rally look less convincing.
What Ethereum Traders Are Watching Next
Ethereum’s immediate focus is around $2,500, which has become an important psychological level after the latest breakout. Holding above it would give bulls a stronger foundation, particularly if ETF inflows remain positive.
The next question is whether ETH can push beyond nearby resistance around the mid-$2,500s. Recent market analysis has identified approximately $2,560 as a level Ethereum needs to clear to strengthen the bullish continuation setup.
The flow data provide another confirmation point. Ethereum’s $141.4 million ETF inflow on September 3 was strong, but traders should look for consistency rather than relying on one session. If ETH receives additional institutional inflows while Bitcoin remains above $80,000, the broader cryptocurrency market could maintain its positive momentum.
If ETH loses $2,500 after the breakout, however, the latest rally could quickly lose some of its strength.
Bullish Scenario for BTC
The strongest bullish scenario is relatively straightforward. Bitcoin holds above $80,000, absorbs profit-taking, and then breaks decisively through the $82,000–$83,000 resistance region. At the same time, U.S. spot Bitcoin ETFs continue receiving meaningful inflows, suggesting that institutional buyers are still willing to absorb supply.
Under those conditions, the market could begin targeting higher resistance levels. Reuters has noted that a sustained break through the current technical barriers could open the possibility of a move toward $90,000, although that should be viewed as a potential market scenario rather than a guaranteed price target.
The most convincing bullish signal would be a combination of higher highs, higher lows, positive ETF flows and declining dependence on forced short covering. That would suggest the market is being supported by genuine demand rather than only leverage.
Bearish Scenario for BTC
The bearish scenario begins if Bitcoin fails to hold $80,000. A rejection from $82,000–$83,000 followed by a rapid move beneath $80,000 would raise questions about whether the breakout was sustainable.
The next important downside area would be around $77,000, where buyers previously defended the market. A confirmed break below that level could shift attention toward the mid-$75,000 region and make the recent recovery look increasingly fragile.
A reversal in ETF flows would make the bearish scenario stronger. If large outflows return while futures leverage remains elevated, forced selling could amplify any decline. This is why traders should not assume that a large inflow day permanently changes market direction.
Bullish and Bearish Scenarios for ETH
Ethereum’s bullish setup depends heavily on its ability to hold $2,500. Continued ETF inflows, improving risk sentiment and a successful move through the $2,560 region could give ETH a stronger technical structure. The latest $141.4 million ETF inflow provides an encouraging starting point, although additional sessions are needed before calling it a durable trend.
The bearish setup would develop if ETH falls back below $2,500 and ETF flows reverse. A deeper decline could then expose lower support levels, particularly if Bitcoin also loses $80,000. Because the two assets remain closely connected through overall crypto-market sentiment, a significant BTC reversal could make it harder for Ethereum to maintain its own breakout.
The important point is that neither scenario is guaranteed. Crypto markets can change direction quickly, particularly when leverage and macroeconomic expectations are both elevated.
Are These ETF Inflows the Start of a New Trend?
The $872.2 million combined inflow is certainly significant, but one day is not enough to establish a long-term institutional accumulation cycle. Bitcoin ETF flows had already demonstrated how quickly sentiment can reverse, moving from a $236.5 million outflow on September 1 to $730.8 million of inflows only two sessions later.
The same pattern appeared in Ethereum. ETH funds went from a $48.2 million outflow on September 2 to a $141.4 million inflow on September 3. This sharp reversal shows that institutional investors are active, but it does not necessarily tell us whether their positions are designed for long-term exposure or shorter-term market opportunities.
The best confirmation would come from several consecutive sessions of strong inflows combined with stable or rising prices. If Bitcoin continues holding above $80,000 and Ethereum remains above $2,500 while ETF demand stays positive, the case for a broader recovery becomes stronger.
For now, the data are encouraging but not definitive. The market has received a powerful demand signal, but it still needs to prove that the signal can persist.
Conclusion
Bitcoin and Ethereum have delivered one of the strongest institutional-demand signals of the recent recovery, with U.S. spot ETFs attracting a combined $872.2 million on September 3. Bitcoin accounted for $730.8 million, its third-largest daily inflow of 2026 according to the latest reporting, while Ethereum attracted another $141.4 million.
The price response was equally notable. Bitcoin moved above $81,000 and briefly reached approximately $82,164, while Ethereum crossed $2,500. At the same time, more than $260 million of Bitcoin short positions were liquidated, showing that leveraged positioning helped accelerate the rally.
The next stage is about confirmation. Bitcoin needs to defend $80,000 and eventually clear the $82,000–$83,000 resistance area, while Ethereum needs to maintain its position above $2,500 and demonstrate that ETF demand can continue. Strong ETF inflows over several sessions would provide a much stronger foundation than a single day of buying.
For now, the crypto market has received a clear signal that institutional demand has returned. Whether that demand becomes a sustained trend or another burst of volatility will depend on the next wave of ETF flows, derivatives positioning, Federal Reserve expectations and, most importantly, how BTC and ETH behave when the initial excitement fades.
Frequently Asked Questions
1. How much money flowed into Bitcoin and Ethereum ETFs?
U.S. spot Bitcoin and Ethereum ETFs recorded approximately $872.2 million in combined net inflows on September 3, 2026. Bitcoin ETFs accounted for $730.8 million, while Ethereum ETFs attracted approximately $141.4 million.
2. Why did Bitcoin rise above $81,000?
Bitcoin’s move was supported by strong ETF demand, improving risk sentiment and a large wave of short liquidations. More than $260 million in Bitcoin short positions were reportedly liquidated during the advance, adding forced buying pressure to the market.
3. What is the next important Bitcoin resistance level?
The $82,000–$83,000 region is an important resistance area. Bitcoin recently reached approximately $82,164, while Reuters identified around $82,793 as a significant technical level.
4. Is Ethereum ETF demand still strong?
Ethereum ETF demand rebounded sharply on September 3 after an outflow the previous day. The latest reported inflow was approximately $141.4 million, with BlackRock’s ETHA and Fidelity’s FETH accounting for almost all of the category’s net inflow.
5. Do large ETF inflows guarantee that Bitcoin will keep rising?
No. ETF inflows are an important demand indicator, but they do not guarantee future price gains. Bitcoin remains sensitive to leverage, Federal Reserve expectations, economic data and sudden changes in investor sentiment, so traders should watch whether strong inflows continue and whether BTC can hold important support levels.